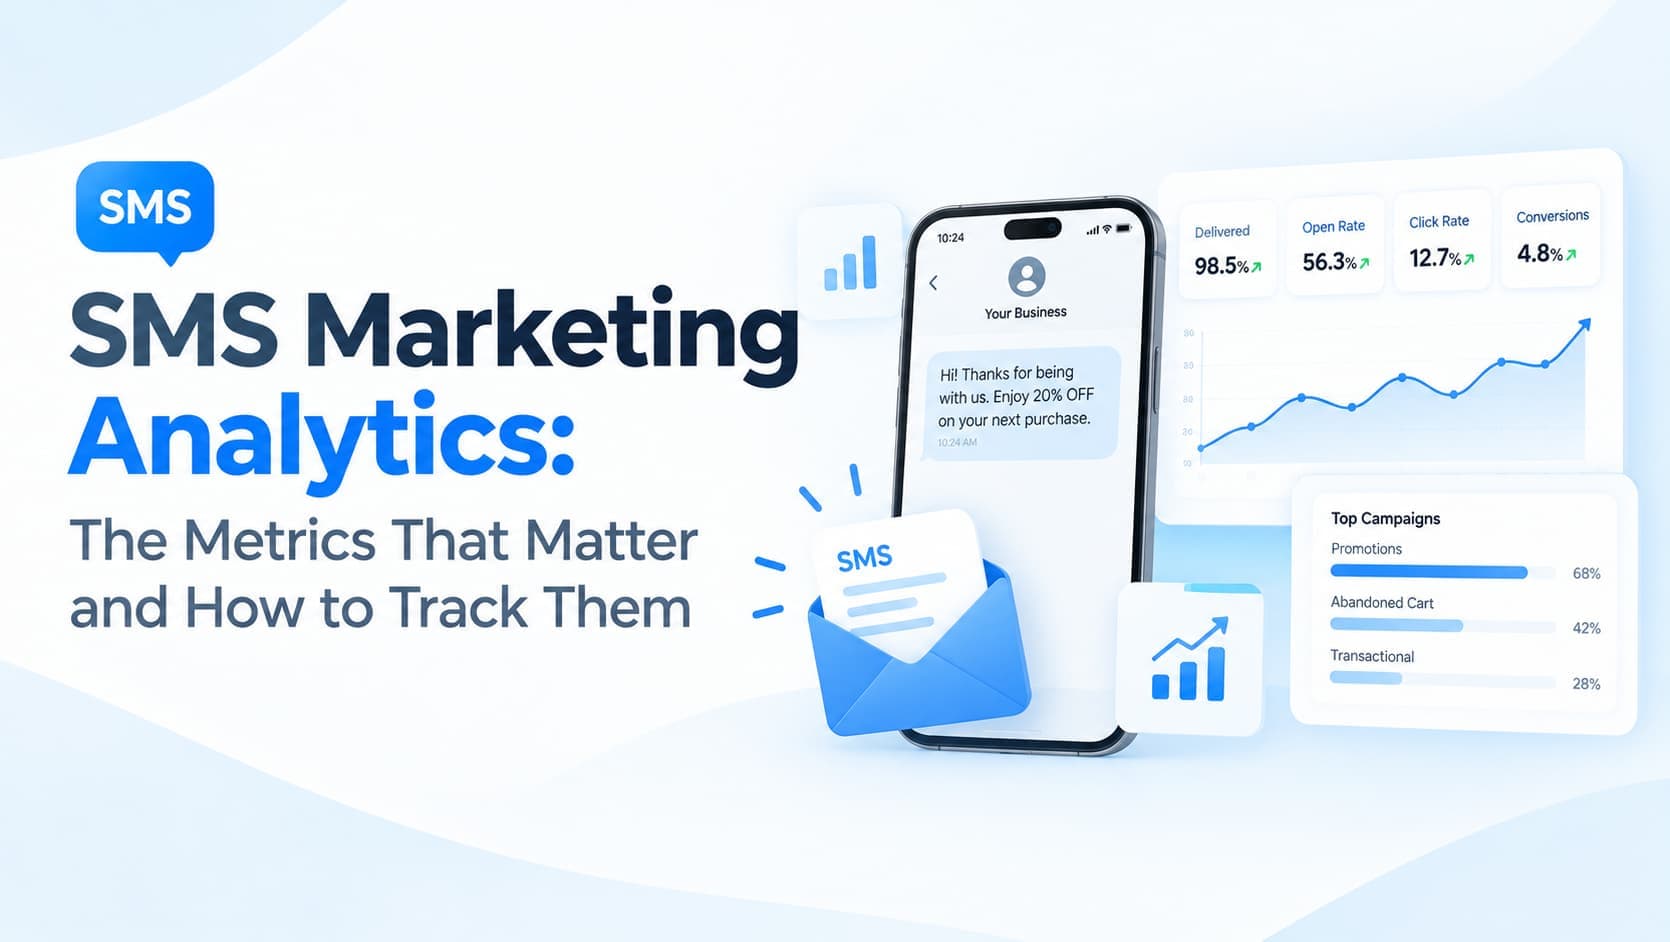
Sending messages is easy. Knowing whether they worked is much harder. SMS marketing analytics turns delivery reports, link clicks and sales data into decisions about which campaigns to repeat, which customer groups to prioritize and where budget is being wasted. You do not need a data science team to do this well. You need a handful of the right metrics, consistent tracking and a habit of reviewing results before planning the next send.
Start With Delivery Rate
Delivery rate is the number of messages delivered divided by the number sent, and it is the first number to check after every campaign. A low rate points to problems such as outdated contact lists, blocked content or weak routes. Look at it by mobile operator and by campaign, because problems often affect one network or one type of message rather than your entire sending. If delivery is poor, no other metric can be trusted, since you are measuring only the audience that actually received the message.
Click-Through Rate Shows Message Appeal
Click-through rate is the share of delivered recipients who click the link in your message. It reveals how compelling your offer, wording and call to action are. To measure it accurately, use a unique tracked link for each campaign, and ideally for each segment, so you can see which combinations of audience and message perform best. Beware of counting repeat clicks from the same person, which can inflate results. Unique clicks give a truer picture of how many people were genuinely interested.
Conversion Rate Connects Messaging to Revenue
Clicks are encouraging, but conversions pay the bills. Conversion rate measures how many recipients or clickers complete the action you wanted, whether that is a purchase, a booking, a registration or a payment. This metric lives mostly outside your SMS platform, so you need to connect it to your website analytics, e-commerce system or customer database. Adding campaign tags to your links lets web analytics attribute sessions and sales to specific messages, and unique promotional codes do the same for in-store or phone purchases.
Watch Opt-Outs and Replies
The opt-out rate is the share of recipients who unsubscribe after a message. It is a quality signal as well as a cost. A rising opt-out rate usually means you are sending too often, targeting the wrong people or sending content that feels irrelevant. Reply rate matters for two-way campaigns. High replies show engagement and sometimes reveal questions your messages leave unanswered, which is useful feedback for improving future copy and customer service.
Cost Per Conversion and Return on Investment
To justify the channel, tie results back to money. Cost per conversion divides the total campaign cost, including message fees and any discounts, by the number of conversions. Return on investment compares the revenue generated against that spend. These numbers make it easier to compare SMS with other channels and to decide how much budget it deserves. Be honest about what counts as revenue generated by the campaign, which brings us to the question of attribution.
Use Control Groups to Measure Real Impact
Customers often buy without any prompting, so crediting every purchase made after a message to SMS overstates its impact. A simple solution is a holdout group, a small random portion of your audience that does not receive the message. Comparing the behavior of the holdout group with that of recipients estimates the true lift produced by the campaign. Even a modest holdout, maintained consistently, gives you a far more credible view of performance than raw totals.
Analyze by Segment
Averages hide patterns. Break results down by customer type, language, location, purchase history and send time, and you will often find surprising differences. Arabic-language messages might outperform in one segment, weekday evenings might beat mornings for another and new customers might respond to different offers than loyal ones. These insights let you tailor future campaigns rather than treating your audience as a single block, which usually improves results and reduces opt-outs at the same time.
Build a Simple Reporting Rhythm
Analytics only helps if it becomes a habit. Review every campaign within a couple of days of sending, looking at delivery, clicks, conversions, opt-outs and cost. Each month, step back and compare campaigns, identify your best and worst performers and check how your list is growing or shrinking. Each quarter, review return on investment, revisit segmentation and plan what to test next. A basic spreadsheet or dashboard is sufficient, provided the same measures are recorded in the same way every time.
Common Mistakes to Avoid
The most frequent error is judging success by the number of messages sent instead of outcomes achieved. Another is comparing very different campaign types as if they were equivalent, since a flash sale and a reminder serve different purposes and should be judged against their own benchmarks. Seasonality can also distort results, because periods such as Ramadan, Eid and major shopping festivals change customer behavior. Finally, avoid drawing strong conclusions from small samples, which can easily mislead.
Conclusion
Good SMS analytics is built on consistency rather than complexity. Track delivery, clicks, conversions and opt-outs for every campaign, tag your links, keep a control group and review results by segment. Over time these habits compound into better targeting, smarter timing and clearer proof that messaging earns its place in your marketing mix. The businesses that learn the most from each send are the ones that improve fastest, and the data to do it is already sitting in your reports.